DAN COOPER GROUP
Industry real estate experts project a continued balanced market for the Greater Toronto Area (GTA) heading into the fall and winter.
In September, total inventory reached 18,912 active listings, the highest level seen since June 2019. This monthly surge of 3,415 listings represents a 22% increase, the most substantial percentage gain since April 2022.
The real estate landscape in the GTA has seen a complex interplay of factors as buyers navigated the challenging environment of rising interest rates over the past 18 months. Buyers and homeowners are now faced with the question of how long these elevated rates will persist. The rise in long-term bond yields, indicating the belief that interest rates will remain at their current levels, has a direct impact on borrowing costs, including mortgages up for renewal. The Canadian real estate market is now adapting to a “higher- for-longer” interest rate environment, where historically low rates may no longer be the norm.
“The short and medium-term outlooks for the GTA housing market are very different. In the short term, the consensus view is that borrowing costs will remain elevated until mid-2024, after which they will start to trend lower. This suggests that we should start to see a market uptick in demand for ownership housing in the second half of next year, as lower rates and record population growth spur an increase in buyers,” said TRREB President Paul Baron.
While property prices continue to rebound and the market remains resilient, the surge in available properties and the uncertainty surrounding interest rates have created a cautious environment for both prospective buyers and sellers. The market’s response to central banks’ announcements and the potential for future interest rate changes underscores its acute sensitivity to broader economic factors. Despite a temporary dip in sales, the month of September witnessed positive price trends across various property segments, further illustrating the demand for housing even in evolving economic conditions.
The average selling price was $1,082,496 as compared to $1,118,374 the previous month. The average price is above last year’s average of $1,079,048. The average number of listing days on the market was 20 as compared to 17 from the previous month. Total active listings were up to 16.5% year-over-year, and new listings were up 16.2% year-over-year, from 10,578 in August 2022 to 12,296 in August 2023.
No one has a crystal ball, so no one can predict further rate hikes, and the market needs to wait and see the full impact the previous rate increases have had on the economy.
INSIGHTS
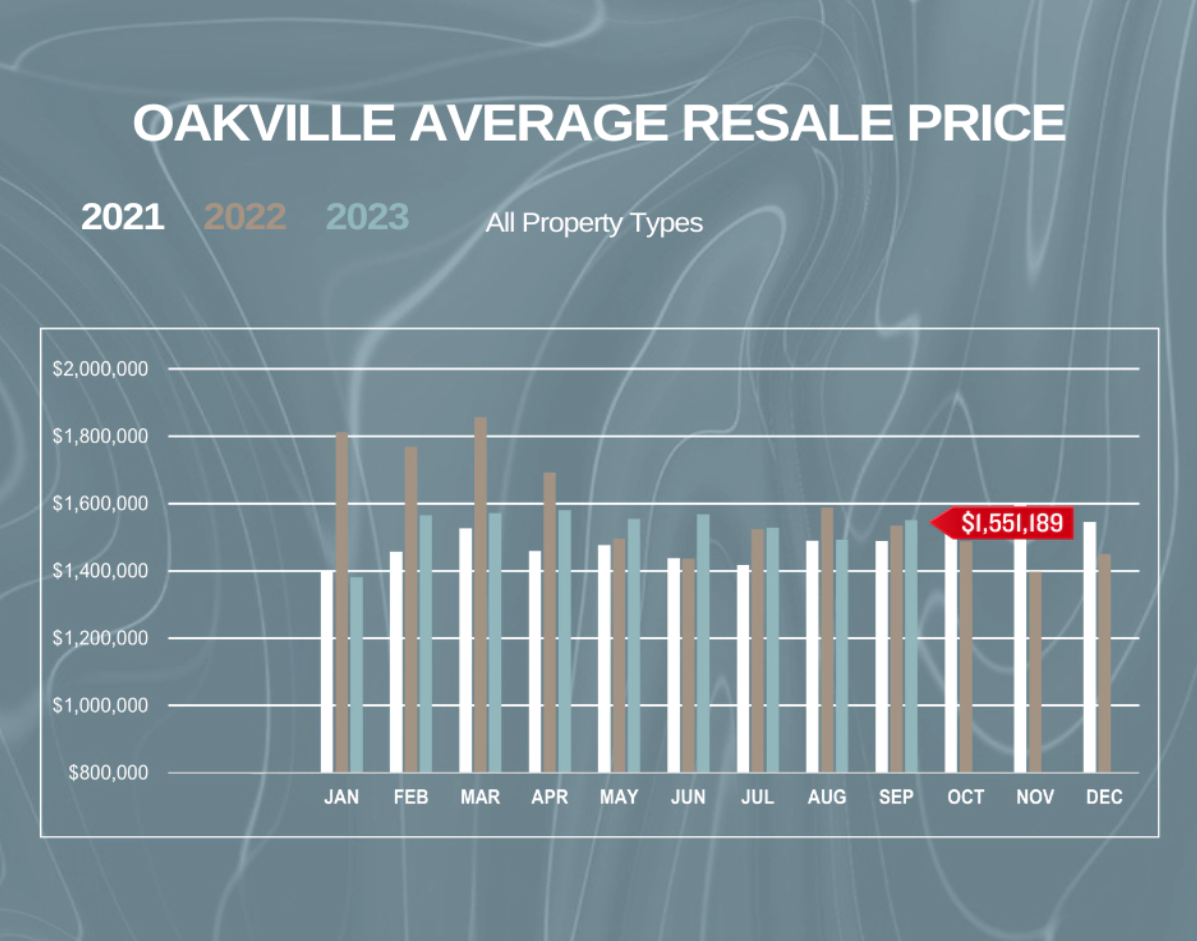
Oakville MARKET INSIGHTS
Market Insights
All property types
SEPTEMBER 2022
SEPTEMBER 2023
191
Homes Sold
-4.71%
183
Homes Sold
$1,534,810
Avg. Resale Price
+1.07%
$1,551,189
Avg. Resale Price
sEPTEMBER 2023 Stats
SALES
AVG PRICE
Detached
Semi-Detached
Townhouse
Condo Townhouse
Condo Apartment
101
7
32
13
27
$1,989,900
$1,129,857
$1,203,563
$986,685
$750,910
Oakville Average Resale Price
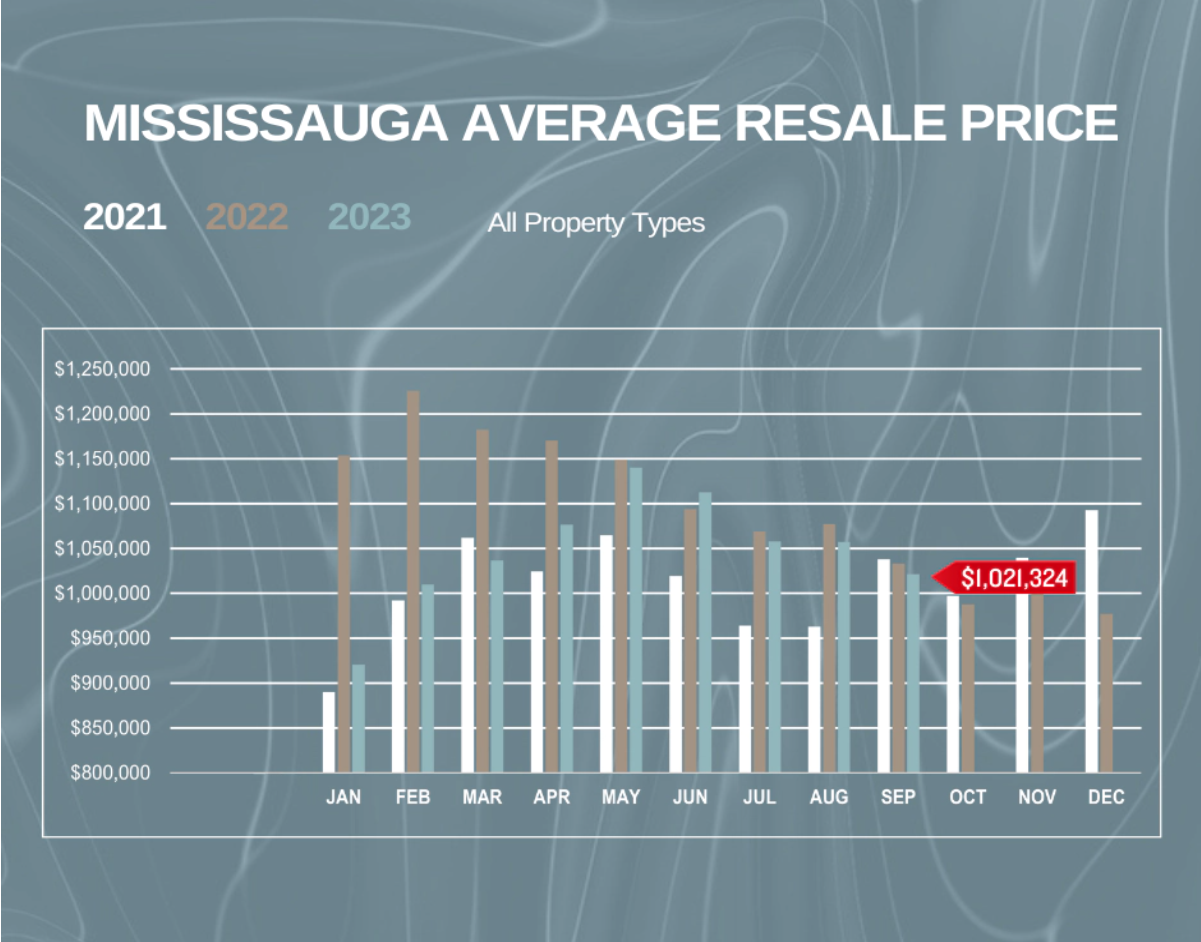
MISSISSAUGA MARKET INSIGHTS
Market Insights
All property types
SEPTEMBER 2022
SEPTEMBER 2023
466
Homes Sold
-17.17%
386
Homes Sold
$1,032,889
Avg. Resale Price
-1.12%
$1,021,324
Avg. Resale Price
SEPTEMBER 2023 STATS
SALES
AVG PRICE
Detached
Semi-Detached
Townhouse
Condo Townhouse
Condo Apartment
140
36
13
72
122
$1,439,735
$1,084,793
$1,028,231
$796,440
$652,653
MISSISSAUGA Average Resale Price
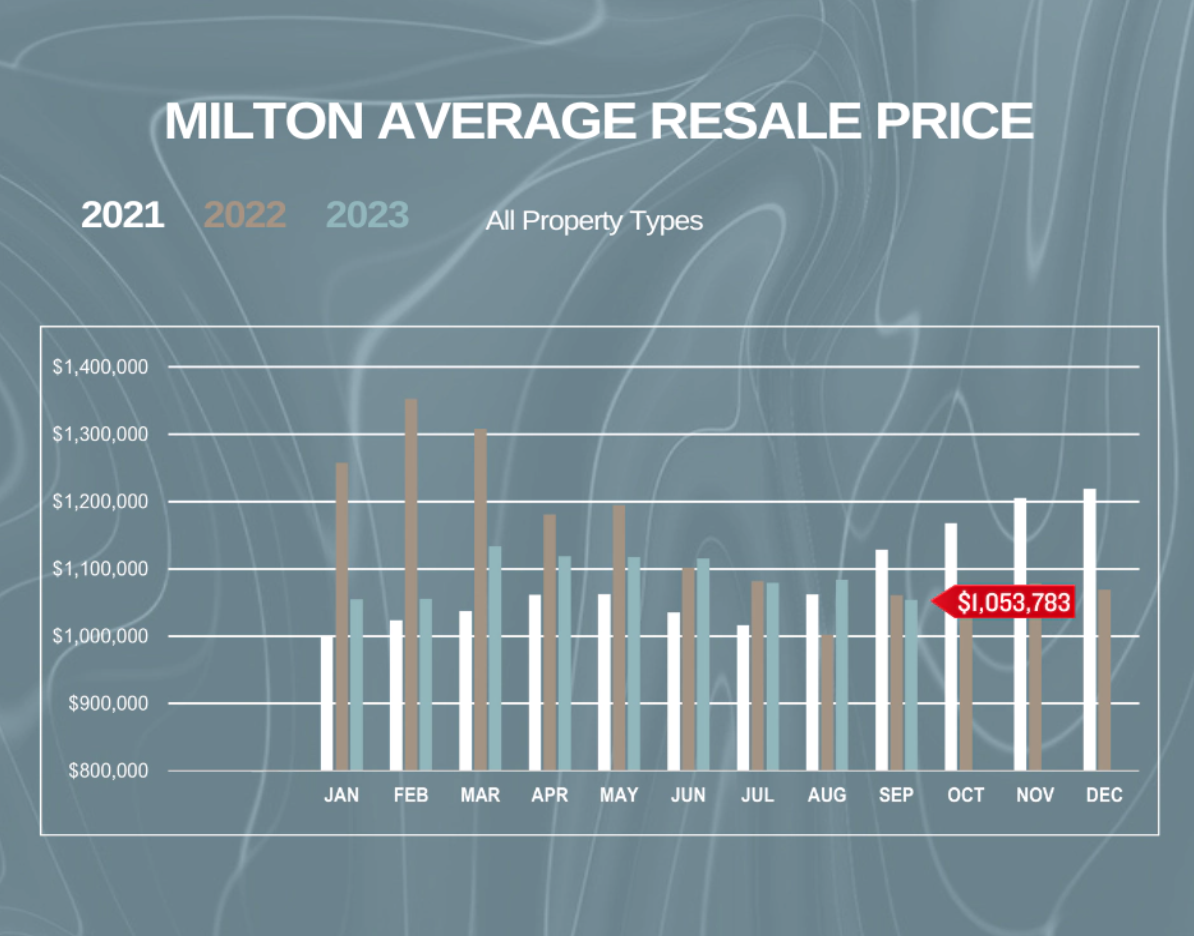
MILTON MARKET INSIGHTS
Market Insights
All property types
SEPTEMBER 2022
FEBRUARY 2024
122
Homes Sold
-18.03%
100
Homes Sold
$1,060,886
Avg. Resale Price
-0.67%
$1,053,783
Avg. Resale Price
SEPTEMBER 2023 STATS
SALES
AVG PRICE
Detached
Semi-Detached
Townhouse
Condo Apartment
Condo Townhouse
45
14
24
3
14
$1,284,663
$1,053,857
$922,100
$782,100
$595,556
MILTON Average Resale Price
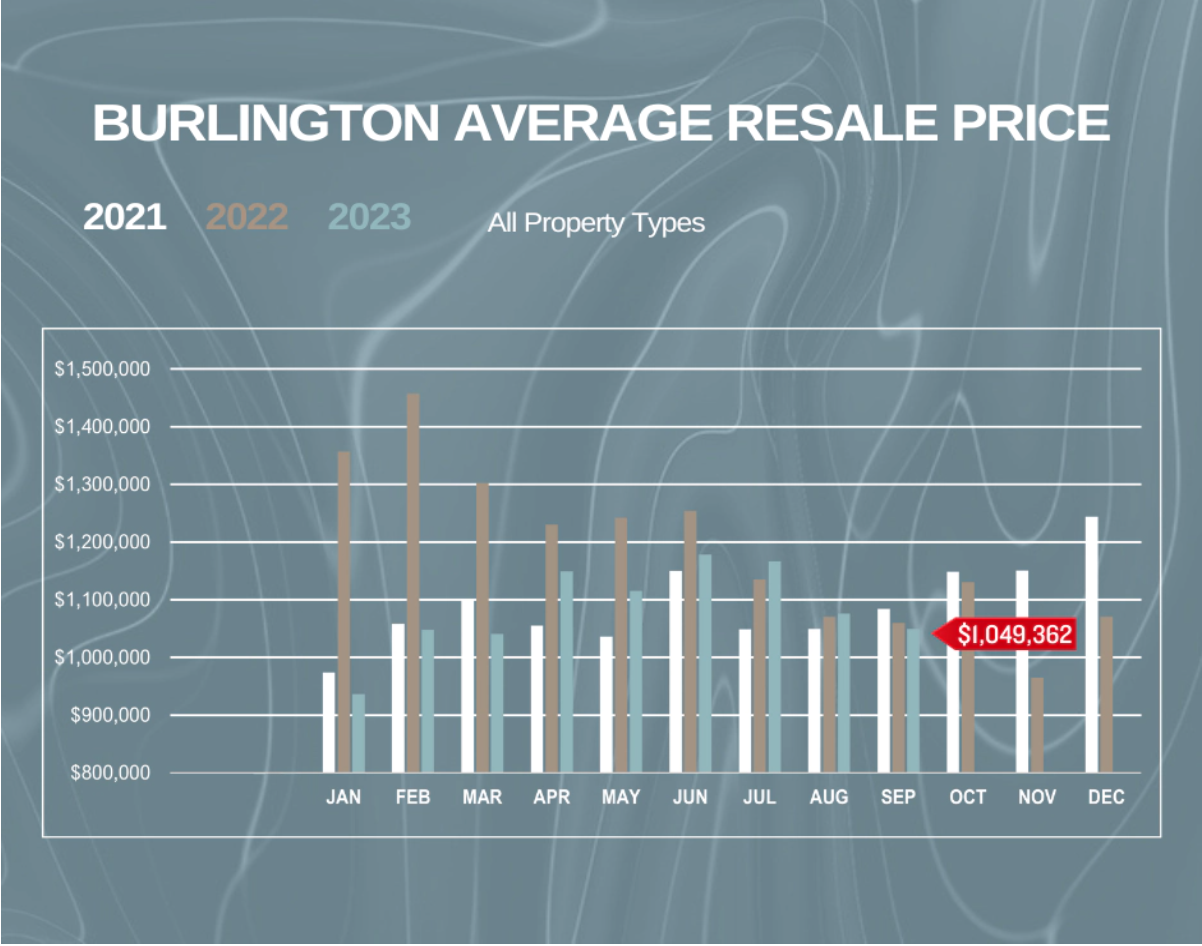
BURLINGTON MARKET INSIGHTS
Market Insights
All property types
SEPTEMBER 2022
SEPTEMBER 2023
182
Homes Sold
-18.68%
148
Homes Sold
$1,059,736
Avg. Resale Price
-0.98%
$1,049,362
Avg. Resale Price
SEPTEMBER 2023 STATS
SALES
AVG PRICE
Detached
Semi-Detached
Townhouse
Condo Townhouse
Condo Apartment
71
8
12
14
40
$1,346,007
$929,863
$958,338
$802,700
$656,808
BURLINGTON Average Resale Price